It's officially going to be Too Hot Out There
Indignity Vol. 4, No. 101

WEATHER DEP'T.
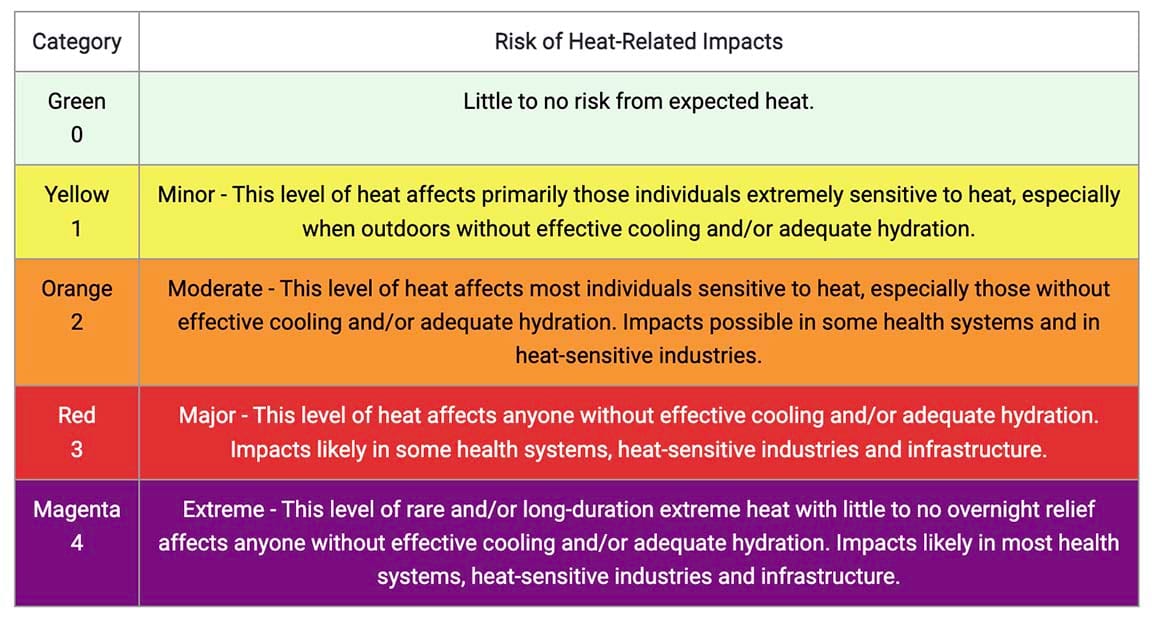
The Government's New HeatRisk Scale Is Heading for Magenta
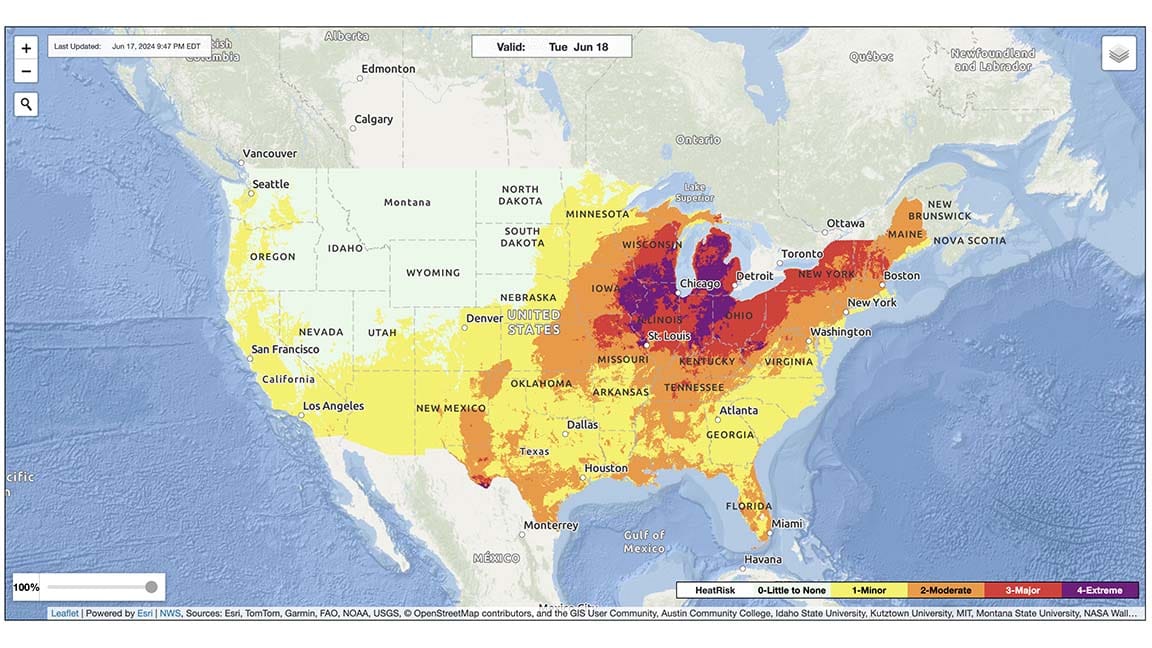
A JUNE HEAT wave is setting in across the week in the Midwest and Northeast, intensifying as it goes. By Thursday in New York City, according to the National Weather Service, the forecast calls for a temperature of 94 degrees Fahrenheit, a heat index of 97 degrees—and, for the first time ever, a HeatRisk level of three, which is coded red, or "Major." Saturday is forecast to reach the top HeatRisk level, level four, "Extreme," which is magenta on the color scale.
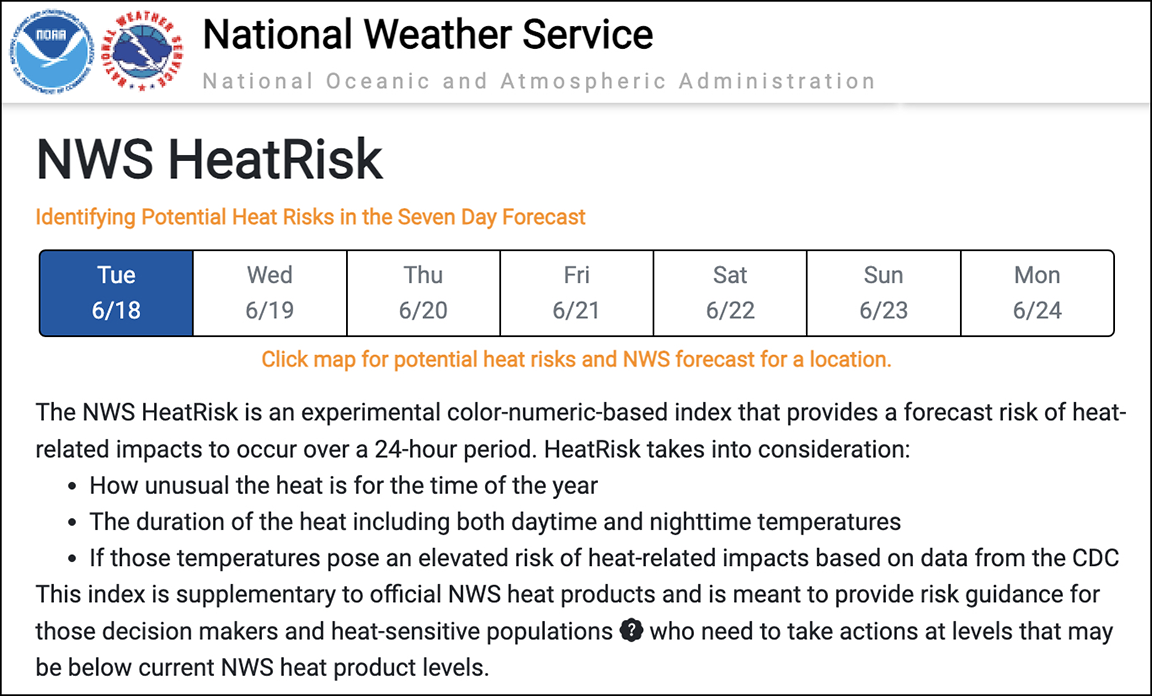
HeatRisk is an experimental new system for reporting what the name says: how dangerous the heat is going to be. Right now, the main ways of talking about excess heat are the plain old temperature; the heat index, which combines heat and humidity to produce a more dramatic-looking temperature number; and the wet-bulb temperature, which measures the limit of how much you can cool off. Plus there's the wet-bulb globe temperature, which combines the wet-bulb temperature with a measure of how much the sun is heating things. But all of these things are reported in degrees Fahrenheit—even though "90 degrees" on the thermometer means a pretty hot day, "90 degrees" on the heat index means a day probably not as hot as that, and "90 degrees" on the wet bulb means death.
Speaking of death—now that more and more people are exposed to the often overlooked lethal force of heat waves—the HeatRisk incorporates past heat-fatality data from the Centers for Disease Control, to evaluate how much harm a particular temperature pattern has done in a particular place in the past. It also tracks not just the daytime highs but the low temperatures overnight, to see how much or how little of a break there will be. And it considers the context of the heat, adjusting for the cumulative burden of multiple hot days in a row, or for the stress of an unseasonably early or late heat wave. But it doesn't bother—at least not directly—with measuring the humidity.
Kimberly McMahon, the Public Weather Services Program Manager for the NWS, talked to Indignity on the phone about where HeatRisk came from and how it works:
Indignity: This is sort of a longstanding question that I've had, about what the best ways to inform people about dangerous heat are. The thing about heat index and wet bulb temperature both seems to me to be that, because they use degrees, there's always the danger of confusion. If you're telling somebody it feels like 95 degrees, but they already have sort of a mental map of what 95 degrees means, how do you cut through that and give people the message that the heat is dangerous at the moment? So I wanted to ask how this system came to be.
Kimberly McMahon, NWS: Back in 2013, the California Office of Emergency Services came to what's called our Western Region and asked about a more consistent approach to warnings for California, because California had such diverse climatology across the entire state. You have coastal areas versus mountainous areas versus more desert, and forest when you get to Northern California.
So we developed HeatRisk, first starting with just California. Based on that prototype, we then expanded to the 24 offices within the Western Region—so generally, Arizona, Utah, Idaho, and Montana westward. Once we expanded it across our western region in 2017, in 2018 we began working with the CDC to incorporate heat health data in order to calibrate our HeatRisk category thresholds, and that work took a couple of years. In 2022 we were able to deploy HeatRisk with those CDC heat health data incorporated into our thresholds, again, to the Western Region. And then, happy to say that Earth Day of this year, 2024, we were able to finally expand it from coast to coast.
Now I can go a little bit into what makes HeatRisk different.
Indignity: Yes, that'd be great. What does differentiate this from all the other ways that we have of getting our heat warnings?
McMahon: So the HeatRisk is a simple color/numeric-based system. And it uses climatology to help put in perspective how hot it is compared to normal. But then it also takes into account that CDC mortality data.
Another thing that makes it different and unique is it takes into account not just the maximum temperature, but it also takes into account the minimum temperature. The reason why low temperatures are important is because if you don't get relief overnight, you can't cool your homes, your body doesn't get a chance to cool, then the impacts of heat just continue to accumulate on the body.
The other thing that makes it unique is that the whole seven day period is analyzed, and it looks for periods of two or more days with excessive temperatures—again, to highlight if that heat is accumulating over days. So if you have a stretch of heat, with each day, the body becomes less tolerant to the heat.
And then the big thing is that there are heat health thresholds incorporated. So it's really marrying the forecasted temperature with climatology—how abnormally hot is it?— and CDC heat health data—you know, is this heat enough to cause health complications?
Indignity: So it's putting together more of a full picture of any particular heat wave. Like in New York, I see we're progressing up to a magenta peak on Saturday, from two days of red, from two days of orange, from yellow today. So the fact that these earlier days were hotter helps contribute to the fact that these later days have a more severe rating?
McMahon: Yes, right.
Indignity: The CDC health data is based on individual localities. Does that reflect how much damage a particular city suffers healthwise because of its particular infrastructure and access to air conditioning?
McMahon: Yeah, the CDC health mortality data should be reflective of the local impact, at least at a county scale, because, yes, if the general population has less access to cooling, such as air conditioning, the historical heat-attributable deaths will be reflected in that.
Indignity: And it comes in a pretty straightforward-seeming system. Rather than navigating the difference between heat index and temperature, then the heat index and temperature and wet bulb temperature, it's just like Code Magenta.
McMahon: And that's not to say that heat index and wet bulb globe temperature don't have their place. Certainly heat index provides context, when you have it with the temperature—here's the temperature, but because of the high humidity, this is how much worse it feels. And then wet bulb temperature really has its place with athletic associations, collegiate and high school athletic departments as well. You know, like marathon organizers. I do know that outdoor worker organizations utilize it because it takes into account the amount of sun and wind. But it's generally designed for those who are healthy, active, rigorous activity outdoors. Depending on the audience, you may need one or more of each of those tools.
Indignity: The wet bulb seems more like for people who are setting out to encounter the weather and know that they are, and the HeatRisk seems more like a way to reach the sort of diffuse populations who don't necessarily know how bad it's going to be.
McMahon: Yeah, the wet bulb globe temperature tends to be used by more informed users, who have familiarity. HeatRisk is for everyone, especially highlighting—impacts can start at different levels for different groups. Those who are more sensitive, they'll be wanting to pay attention when HeatRisk is yellow and orange. So it really does help fill gaps that heat impacts occur on a spectrum.
Indignity: And all this happens against the backdrop that, historically, we are pretty chronically bad at understanding how dangerous heat waves are, right? That the excess deaths from heat waves tend to get overlooked. As we're having more and more heat waves, it seems very helpful to have a prospective warning that builds in the prior knowledge from CDC about how serious and dangerous these events are.
McMahon: I would just add that heat, unlike many other weather hazards—it doesn't have a visual component. So you look at tornado damage, and you see that. You can remember it. You can internalize it. Because the main impact from heat is heat illness—either going to the hospital, having ambulatory service, or unfortunately, having deaths due to the impacts of heat—I think that it's harder for that message to get across, because there isn't a visual component to it.
But also the fact that it is a health impact. There isn't a one-size-fits-all. There isn't a, you know, heat index turns 100 degrees and everybody starts feeling the impacts, right. It depends on personal circumstances, personal health, access to cooling and hydration. So it makes it more difficult to communicate on an individual case-by-case basis when people will start feeling the impacts of heat and how bad those impacts will be. Could it just be nausea due to heat exhaustion, or is it blacking out and having to be sent to the hospital to be cooled immediately from a more extreme sense of heat exhaustion into heat stroke?
Indignity: Was there anything in the course of developing HeatRisk that was a surprise—about what had needed to be incorporated into it, or about how putting it together worked, about what was and wasn't useful information in getting to this bottom line?
McMahon: What we found was helpful is having the category thresholds actually change with climatology. So the threshold for Major, with red, in one location will be different than another location. It won't be quite the same degrees.
But also it will change throughout the year, because, for example, in spring coming out of the winter, your body has not had a chance to acclimate to the warmer temperature. So that's why we see a lot of heat impacts, healthwise, when we have an early season heat wave. People's bodies have not had a chance to acclimate to the heat, because it takes about five days to two weeks for the human body to acclimate to the heat and to do so in a safe manner. Then as we get to the fall, the thresholds decrease from a temperature perspective. In the fall, if you have a cool period and then another heat wave, it will signal that this is abnormally warm and have health impacts.
Indignity: Are there some examples of regions that had different thresholds because of their markedly different climatology?
McMahon: The levels are based on percentage of climatological hot temperatures and low temperatures. So for example, if you take Bangor, Maine, the 95th percentile, which is where our Major, red level starts, that will be lower as a temperature value than the 95th percentile in Arizona. But those will both be red.
Indignity: Are we talking temperature here, or or heat index?
McMahon: That's the temperature influence.
Indignity: Is heat index also incorporated this way, with these climatological percentiles?
McMahon: Nope, right now, HeatRisk only uses the maximum temperature and the minimum temperature in the forecast during this evaluation period. Hence why it's experimental right now where we are evaluating and we're collecting comments to see if we need to make any improvements before we take it operational.
The public comment period ends September 30, and then we will need a couple of months to review. From my understanding—I haven't had a chance to see it, but we have a lot of comments, in the hundreds, that will impact how long it takes us to actually evaluate. If we don't have to make any major changes in our evaluation of the public comments and the performance that it's doing this summer, there's the potential to go operational in 2025
Indignity: So humidity just doesn't factor in at all? If heat index isn't in there, it's just temperature-based at this point?
McMahon: For roughly the eastern half of the United States, there are—sorry, let me back up for a second. There are well known meteorological relationships between relative humidity and the minimum temperature. So to try to account for the influence of humidity, utilizing the minimum temperature, for areas that are more humid, we do weight the minimum temperature a little bit more so than in areas out West. Just to help account for that humidity influence by utilizing the relationship between humidity and the minimum temperature.
Indignity: It is interesting to see how these things are inscribed in the system, without directly incorporating them. I think the thing that has always occurred to me is, I'm from Baltimore originally, and so when I see that, like it's 92 degrees, but it feels like 104—because I'm from Baltimore, my understanding of 92 degrees has that humidity built in. You know what I mean? Like, I've never felt a dry 104.
So what you typically expect, communitywise, from say 92 degrees is probably, unfortunately, built into the CDC numbers, right? Because those measure what's actually happening to people's bodies in that particular county under that particular temperature, on average.
McMahon: Part of it is, yes, the death certificate information over the years. I know CDC has made greater and greater advancements in standardizing the reporting across the country, or specifically for heat death, they have been providing training, more training on, OK, what is the actual cause? Someone could have, for example, a heart attack. But was it the heart attack, you know, or was it actually from the heat? If the heat hadn't happened, that person may not have had a heart attack.
But basically, the data that the CDC provided us to incorporate into HeatRisk should be reflective of the local ecology, and if you live in a more humid climate, then yes, that will be reflected.
And I totally understand your comment. I live near Baltimore now, and I grew up on Long Island, New York. I'm very well aware of what humidity effects are from a personal standpoint, but I also lived out in the desert Southwest. I will say that heat is dangerous in both aspects. With the dry heat, it's the fact that your body is evaporating your sweat and you have to stay hydrated in order to maintain your body's ability to keep sweating. It just doesn't feel as stuck on you and doesn't feel as oppressive, but it's still dangerous, because there's only so much that your body, or the human body, can keep up with keeping you cool. On a more humid climate, it's really the fact that the humidity in the air is preventing the sweat from your body to leave your body, so it just stays on your body and the heat doesn't get evaporated off. So you can't quite cool as efficiently, but you still need to stay hydrated, because you are sweating.
Correction: The introduction originally described red as level four and magenta as level five; HeatRisk is a five-step scale, but the lowest level is zero, so red and magenta are three and four, respectively.

WEATHER REVIEWS

New York City, June 16, 2024
★★★★★ Light bounced off the floor and the ceiling and the eternal four walls of the bedroom. From the balcony, the sky was densely dotted with little white cloud-splotches on blue. From the balcony, the air was dry and cool. A robin erupted from a tree with almost a crackling sound, flying almost head-on at the balcony, rising toward an upper corner where the building wrapped around the back gardens. From the balcony, the short flights of birds were intimations of a whole world unseen and unreachable, open grassy lawns, country fields. Right there on the balcony the leaves of the spider plant, some squared off where their burnt tips had been trimmed away, quivered in place. The air tickled at the bottom of the weary lungs. In the moments before sunset the empty-seeming blue sky over the balcony acquired the faintest washes of rose, as some dark little swift or swallow veered and chittered this way and that, high against it. An invisible layer of clouds suddenly showed up pink and solid over the balcony, in the light of what was now at last sunset, and then faded to vanishing whites and grays. It was a little chilly in the dusk on the balcony, and the forecast said no one knew when it might be that way again.
EASY LISTENING DEP'T.
CLICK ON THIS box to find the Indignity Morning Podcast:

SANDWICH RECIPES DEP'T.
WE PRESENT INSTRUCTIONS in aid of the assembly of a sandwich selected from Mrs. Ericsson Hammond's Salad Appetizer Cook Book, by Maria Matilda Ericsson Hammond. Published in 1924, and now in the Public Domain and available at archive.org for the delectation of all.
Shrimp Sandwiches with Oyster à la Archibald
Sandwiches de Crevettes aux Huitres à l'Archibald
For ten sandwiches take ten slices of bread, one quart of cooked oysters, one pound of small cooked shrimps, a teaspoonful of anchovy paste, three tablespoonfuls of butter, pepper and salt.
How to Make It. Slice the bread and cut it out with a round patty cutter; spread it with butter and anchovy paste mixed. Save one oyster for each sandwich; the rest chop; spread it on the sandwich; chop half of the shrimps, leaving the even-sized ones for decoration. Put the oysters on a broiler and glaze them with the chaudfroid sauce. [See Chaudfroid Mayonnaise Sauce]. Decorate each oyster with a star of truffle and then glaze the star with some aspic; put a row of the chopped shrimps all around the sandwich that has been seasoned with pepper, salt, and some lemon juice; in the center put the oysters. Stir the butter to a cream; put it in a paper bag with a very small hole and with a strip of stirred butter decorate all around on top of the shrimp in scallops. Arrange them in the form of a ring on a platter; put a bunch of water cress in the center and garnish with the unpeeled shrimps all around. Serve before the soup.
Mayonnaise Chaudfroid Sauce
Sauce au Chaudfroid de Mayonnaise
Put in a saucepan a half cup of milk; add four tablespoons dissolved Cox’s gelatine; stir on ice until it gets cold. Put in a saucepan four tablespoons of mayonnaise dressing highly seasoned with lemon juice, pepper, and salt; pour the milk with the gelatine to the dressing carefully and stir very fast; then, last, add six tablespoons of heavy cream. This is a chaudfroid glaze for different kinds of cold entrees, cold dishes, and fish and meat appetizers, with the difference that if for fish, flavor with more lemon juice.
If you decide to prepare and attempt to enjoy a sandwich inspired by this offering, be sure to send a picture to indignity@indignity.net.
MARKETING DEP'T.

Supplies are really and truly running low of the second printing of 19 FOLK TALES, still available for gift-giving and personal perusal! Sit in the gathering heat with a breezy collection of stories, each of which is concise enough to read before the thunderstorms start.

HMM WEEKLY MINI-ZINE, Subject: GAME SHOW, Joe MacLeod’s account of his Total Experience of a Journey Into Television, expanded from the original published account found here at Hmm Daily. The special MINI ZINE features other viewpoints related to an appearance on, at, and inside the teevee game show Who Wants to Be A Millionaire, available for purchase at SHOPULA.